Visual graphs and charts for flashcard statistics

Hailibu

秀才
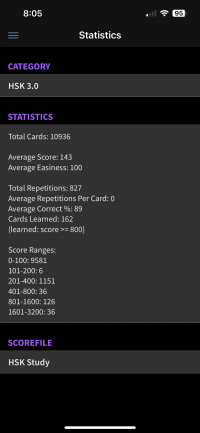
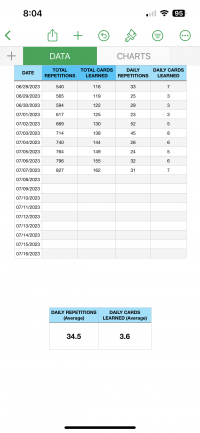
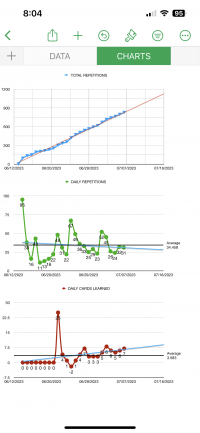
Im a visual learner, and I find it motivating and helpful to visually see my progress over time from studying flashcards. Currently Pleco provides a list of flashcard statistics, but it doesn’t really show trends, just more of a numerical snapshot. Attached are screenshots showing a Numbers spreadsheet and charts that I manually update after each flashcard session. Does anyone else do this? I’m curious to see screenshots from others for ideas.

I placed this in Future Products, because I hope Pleco adds something like this one day.
 

Attachments

  • IMG_9768.png
    IMG_9768.png
    290.2 KB · Views: 144
  • IMG_9766.png
    IMG_9766.png
    671.6 KB · Views: 125
  • IMG_9767.png
    IMG_9767.png
    569.9 KB · Views: 129

Ledu

举人
I used to try to keep a spreadsheet but it became too tedious. After that I would just screen shot my statistics pages. Since I don't use SRS, I study 100 cards a week. By the end of the week my stats are near perfect so I can assume I learn 14 cards per day. I study these with four tests. I keep track with a simple document noting which tests I did for the day. I use screen timer on my tablet to easily see how long I have studied vocabulary each day. I just have to make sure Pleco app isn't in the background when I am not studying or the screen timer won't be accurate. So just a word document with Tests done and Vocab Studied by hours and minutes per day.
 
Top